
Let's be honest. For too long, "measuring marketing" meant staring at dashboards full of fuzzy numbers. Clicks, impressions, likes—they all felt good, but they didn't answer the one question the CFO kept asking: "So, what did we actually get for all that money?"
It's time to connect the dots. Real marketing measurement is about proving, without a doubt, how your work drives revenue. It’s about building a case so strong you can confidently justify your budget and pour more fuel on the fire for what's actually working.
The New Playbook for Marketing Measurement

Forget the old way of doing things. The days of siloed reports and chasing vanity metrics are over. In today's messy, multi-channel world, that approach is flat-out broken. It leaves you scrambling for answers when leadership wants to see a return on their investment.
This guide isn't about finding some mythical, all-in-one metric. It’s about building a Unified Measurement Framework that acts as your single source of truth. Think of it as blending all your data streams—from social to search to email—into one clear picture of what’s happening.
The goal here is simple: move past last-click thinking and finally see the entire customer journey for what it is. Your strategy needs to be:
- Big-picture enough to show the overall impact on the bottom line.
- Detailed enough to pinpoint the specific touchpoints that nudge a customer toward a purchase.
This mindset is the foundation for everything we're about to cover. It’s practical, it’s results-focused, and it just works.
Adopting a Unified Framework
A unified framework isn't just about collecting data; it’s about connecting it. You stop looking at social media engagement in one place and email clicks in another. Instead, you start seeing the whole story—how a clever Instagram post led to a newsletter signup that, three weeks later, turned into a $500 sale.
This isn't just a "nice-to-have" anymore. With new privacy rules and data headaches popping up everywhere, old-school tracking is becoming less and less reliable. We're all being pushed to connect the dots from different sources while playing by new rules. It's a challenge, but it's also where the real breakthroughs in measurement are happening.
A modern measurement strategy isn't about having more dashboards. It's about having one cohesive story that connects every marketing dollar spent to a clear business outcome.
Key Pillars of a Modern Measurement Strategy
Before we dive deep, let's get a handle on the core pillars of this new playbook. To show how all the pieces fit together, this table breaks down the essential parts of a modern marketing measurement strategy. It gives you a quick visual summary of the core concepts.
Key Pillars of a Modern Measurement Framework
| Framework Component | What It Achieves | Example Metrics to Track |
|---|---|---|
| Business Outcomes | Ties every marketing action directly to top-level business goals. | Customer Lifetime Value (CLV), Revenue Growth, Market Share |
| Marketing Mix Modeling | Provides a top-down view of how different channels contribute to sales. | Channel ROI, Contribution by Tactic, Media Spend Effectiveness |
| Multi-Touch Attribution | Gives credit to all the touchpoints that influenced a conversion, not just the last one. | Assisted Conversions, Time to Conversion, Path to Conversion Analysis |
| Experimentation | Uses A/B tests and controlled experiments to prove cause and effect. | Conversion Rate Lift, Incrementality, A/B Test Significance |
Getting these pillars right is the first step. They ensure every action has a purpose. For instance, as influencer marketing becomes a bigger piece of the puzzle for many brands, accurately measuring the ROI of influencer marketing becomes a non-negotiable part of this framework.
Ultimately, this all loops back to your budget. A unified strategy has a direct impact on your https://creativize.net/blog/marketing-budget-planning, giving you the hard data needed to allocate money with confidence. This new playbook doesn't just help you defend your budget—it gives you the evidence you need to prove why it should be even bigger.
Connecting KPIs to Your Marketing Funnel

Just gathering a pile of metrics won't get you very far. The real magic happens when you connect the right Key Performance Indicators (KPIs) to each stage of your marketing funnel. This is how you turn a jumble of data into a clear story about your customer's journey.
It’s easy to get sidetracked by vanity metrics—think social media impressions or total page views. They look impressive on a report, sure, but they don't actually tell you if you're making progress toward a sale. To get real insight, you need to focus on actions that show a potential customer is getting warmer.
This means mapping everything back to the funnel and, ultimately, to revenue. Your success hinges on picking the right KPIs for each stage: awareness, consideration, and decision.
Top of the Funnel: Who Knows You Exist?
At the top of the funnel (ToFu), your entire goal is to get your brand in front of new eyeballs. Forget just counting impressions, which only tells you that your ad was displayed somewhere. You need to know if you're actually capturing a piece of the conversation.
Here's what to track:
- Share of Voice (SoV): How often is your brand mentioned compared to your competitors? Are you showing up in industry chats on social media or in the press? Tools like Brandwatch can give you a clear picture.
- Website Traffic Growth: I’m not talking about total traffic. Look specifically at the percentage increase in new users hitting your site, especially your blog or resources. This tells you if your content is doing its job and pulling people in.
- Branded Search Volume: This one is a huge tell. When you see a spike in people Googling your company name directly, it's a powerful sign that your brand recognition is on the rise.
These KPIs show you're successfully grabbing attention, not just that your ads are running on empty.
Middle of the Funnel: Are They Seriously Considering You?
So, they know who you are. Great. The next step is getting them to actually evaluate what you offer. This is the consideration stage (MoFu), and it’s all about the quality of engagement, not the quantity.
A click is a start, but what happens after the click is what really matters. I’ve seen teams chase high click-through rates, only to see those users bounce immediately. That's not consideration; it's a wasted ad dollar.
Meaningful MoFu metrics look like this:
- Content Engagement Time: How long are people actually sticking around on your key landing pages or blog posts? A high average time on page is a good sign your content is hitting the mark.
- Newsletter or Lead Magnet Sign-ups: This is a big one. When someone trusts you with their email for a guide, webinar, or newsletter, they’re signaling real interest.
- Demo Requests or Consultation Bookings: This is a high-intent, money-on-the-line action. Tracking how many people go from reading a blog post to booking a meeting with sales is a critical MoFu metric.
Bottom of the Funnel: Is This Actually Making Us Money?
Welcome to the bottom of the funnel (BoFu). This is where every marketing effort has to tie directly to revenue. No more fuzzy metrics—it's all about business impact.
You need to be laser-focused on these three KPIs:
- Customer Acquisition Cost (CAC): In plain English, how much do you have to spend in marketing and sales to land one new paying customer?
- Customer Lifetime Value (LTV): What's the total amount of money you expect to make from a single customer over their entire time with you? For a healthy business, your LTV needs to be way higher than your CAC.
- Conversion Rate by Channel: This is about efficiency. Which of your channels are the real workhorses? Knowing your podcast ads convert at 3% while your search ads only convert at 1.5% tells you exactly where to put your next dollar.
To tie this all together and see how your overall marketing machine is performing, you can dive into Mastering the Marketing Efficiency Ratio (MER).
By connecting the right KPIs to each stage of the funnel, you build a logical framework that proves exactly how your marketing is driving real, profitable growth.
Choosing Your Data Toolkit and Attribution Model

Let's get real. Great measurement isn't just about having a strategy. It's about having the right gear to actually collect and make sense of your data. Without a solid toolkit, you’re just guessing—flying blind and hoping your marketing efforts are somehow connecting and leading to sales.
The good news? You don't need a crazy-expensive or overly complicated tech stack. A few key pieces can give you a surprisingly powerful foundation for measuring marketing effectiveness. Think of them as the must-have instruments in your measurement orchestra.
Assembling Your Core Data Toolkit
Your toolkit's job is to capture what users are doing, manage customer relationships, and show you the data in a way that’s actually useful. For most businesses I work with, this boils down to three core platforms.
- Website Analytics (Google Analytics 4): This is non-negotiable. GA4 is built around events and the entire user journey, which makes it miles better than its predecessor at tracking how people interact with you across different devices. It's the engine that tells you what’s happening on your site.
- Customer Relationship Management (CRM): A good CRM like HubSpot or Salesforce is where all your customer data comes to life. It connects the dots between a marketing touchpoint and an actual sale, showing you which leads became paying customers.
- Data Visualization (Looker Studio): Let's be honest, raw data from GA4 and your CRM can be a nightmare to look at. A tool like Looker Studio (what used to be Google Data Studio) pulls everything into clean, interactive dashboards. This makes it so much easier to spot trends and share what you've found with your team.
Of course, to measure performance accurately, you need to set up tracking correctly from day one. A huge piece of this puzzle is knowing how to implement comprehensive Google Ads Conversion Tracking so you can give proper credit where it's due for your paid campaigns.
Demystifying Marketing Attribution Models
Okay, so your tools are collecting data. What's next? You have to pick an attribution model. This is just a fancy term for the set of rules you use to give credit for a sale or conversion to the different marketing touchpoints along the way.
Choose the wrong model, and you could end up gutting a channel that’s quietly doing amazing work for you while pouring money into one that’s just taking the final bow.
Key Insight: Your attribution model isn't a "set it and forget it" decision. It needs to match your campaign goals and how long it typically takes to make a sale. The model for a quick e-commerce purchase is totally different from one for a six-month B2B sales cycle.
Comparing Common Attribution Models
So which model is right for you? It really depends on what you’re trying to achieve. Here's a quick rundown to help you decide.
| Attribution Model | How It Works | Best For… |
|---|---|---|
| Last-Click | Gives 100% of the credit to the final touchpoint before conversion. | Campaigns with short sales cycles where you want immediate action, like a "Buy Now" Google Shopping ad. |
| First-Click | Gives 100% of the credit to the very first touchpoint a customer had with you. | Brand awareness campaigns where the main goal is simply introducing new people to your brand. |
| Linear | Spreads the credit equally across all touchpoints in the customer's journey. | Longer B2B sales cycles where lots of interactions (e.g., blog, webinar, demo) all play a part. |
| Data-Driven | Uses machine learning to figure out which touchpoints were most influential and assigns credit accordingly. | Businesses with enough conversion data for the algorithm to learn from. It’s the most accurate, but it needs volume. |
Think about it like this: a customer first finds your brand through a LinkedIn article (First-Click), then a week later they attend a webinar (middle touchpoint), and finally, they buy after clicking a retargeting ad on Facebook (Last-Click).
A Last-Click model gives all the glory to that Facebook ad, completely ignoring the hard work the LinkedIn article and webinar did. A Linear model would give each one 33% credit, which feels more fair. But a Data-Driven model might analyze everything and find the webinar was the real game-changer, giving it 50% of the credit. Making sense of these interactions is absolutely fundamental to understanding your overall campaign performance metrics.
By carefully picking your tools and the right attribution model for your business, you build a system that does more than just spit out numbers—it tells the real story of how your marketing is creating value.
So, you've got your core metrics dialed in. That's fantastic. Now, it's time to level up from simply tracking channel performance to actually predicting your next big move. This is where we go beyond the standard dashboard and start using advanced analytics to get a bird's-eye view of your entire marketing ecosystem.
The heavyweight champion in this arena is Marketing Mix Modeling (MMM). Think of it as your strategic crystal ball—a powerful, privacy-friendly way to understand how all your marketing ingredients, from TV ads and digital campaigns to PR pushes, work together to cook up results like sales and revenue.
What Exactly Is Marketing Mix Modeling?
Unlike attribution models that obsessively follow individual customer journeys, MMM takes a step back. It uses statistical analysis to look at your business from 30,000 feet. This is the tool that answers the tough, big-budget questions that keep your CFO invested: "If we drop an extra $1 million into marketing next quarter, where does it go to make the biggest impact?"
MMM digs into your historical data, usually over a couple of years, to figure out the true influence of each marketing channel. Crucially, it also accounts for all the outside noise—things like seasonality, economic shifts, and what your competitors are up to. This makes it incredibly solid for long-term strategic planning.
This graphic really nails how the high-level metrics in these models connect, showing the journey from initial engagement to the financial finish line.
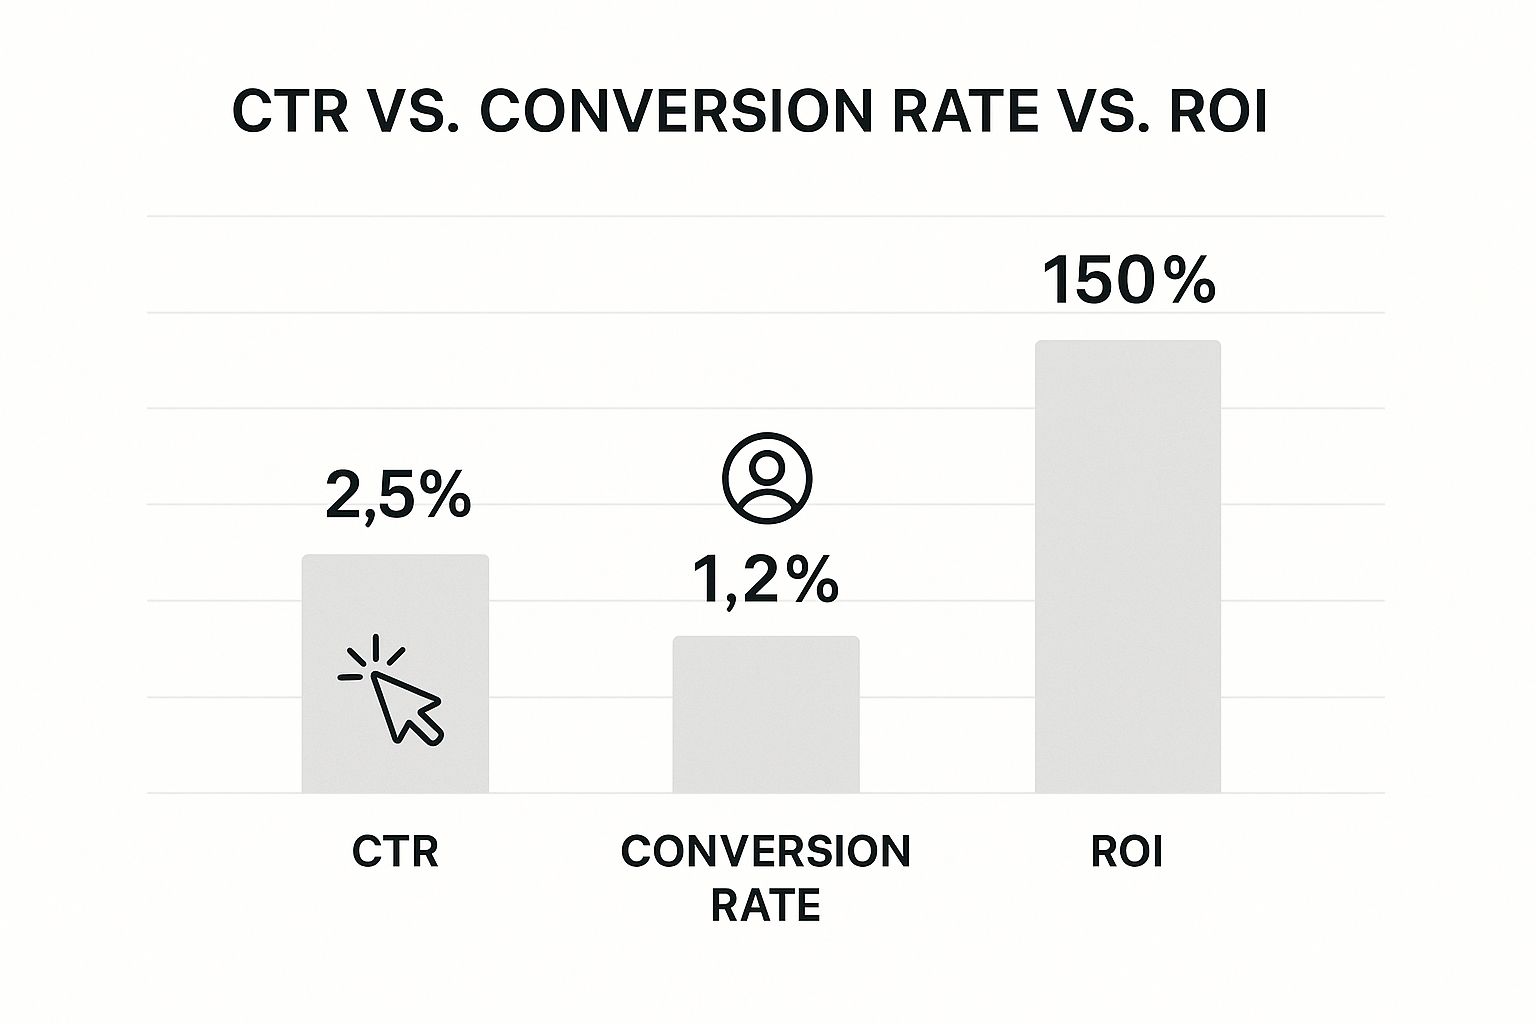
You can see how a broad click-through rate (CTR) narrows down to a much smaller conversion rate, which ultimately determines your ROI. It’s a perfect visual for connecting the dots between tactical actions and bottom-line results.
Modern MMM Is More Than Just Money
Marketing Mix Modeling isn't stuck in the past, just crunching media spend and sales figures. The field is evolving fast to reflect what consumers and companies care about today. The smartest brands are now weaving metrics into their models that go way beyond the profit and loss statement.
A huge trend we're seeing is the inclusion of things like sustainability and social impact. A company might, for instance, track its Carbon Footprint Reduction or Social Return on Investment (SROI) right alongside sales data. This lets them see how their purpose-driven campaigns affect not only revenue but also brand health and public trust, making sure their marketing effectiveness aligns with their bigger mission.
My Take: MMM gives you the strategic guts to make bold budget calls with real confidence. It shifts the entire conversation from "Which ad got the last click?" to "What's the winning combination of investments that will drive the most growth next year?"
attribution-models
Picking the right attribution model is a whole different ballgame. It's less about the 30,000-foot view and more about understanding the customer journey on the ground. There's no single "best" model—it all comes down to what you're trying to achieve with a specific campaign.
I've put together a quick comparison to help you sort through the most common options and see which one fits your needs.
A Practical Comparison of Attribution Models
A head-to-head look at the most common marketing attribution models to help you pick the right one for your specific goals and campaigns.
| Attribution Model | How It Assigns Credit | When to Use It | The Main Drawback |
|---|---|---|---|
| First-Touch | The very first channel a customer interacts with gets 100% of the credit. | Great for top-of-funnel campaigns where brand awareness and demand generation are the main goals. | It completely ignores all the valuable touchpoints that happen later in the customer's journey. |
| Last-Touch | The very last channel a customer interacts with before converting gets 100% of the credit. | Simple and useful for short sales cycles or campaigns focused on driving immediate action, like a flash sale. | It gives zero credit to the channels that introduced the customer to your brand in the first place. |
| Linear | Credit is split evenly among all touchpoints in the customer journey. | A fair, balanced approach when you believe every interaction plays an equal role in the final conversion. | It can undervalue more influential touchpoints and overvalue minor ones, treating them all the same. |
| Time-Decay | The touchpoints closest in time to the conversion get the most credit. | Perfect for longer consideration cycles, as it values the interactions that happen right before the decision. | It can still diminish the critical role of early, awareness-building channels that started the journey. |
| U-Shaped | Gives 40% credit to the first touch, 40% to the last touch, and splits the remaining 20% among the middle touches. | A solid choice when you value both the first interaction (awareness) and the final one (conversion) the most. | The middle touchpoints, which nurture the lead, might not get the credit they truly deserve. |
Ultimately, the best model depends entirely on your campaign's objective. Are you trying to find new customers or close existing leads? Answering that question is the first step to choosing the right attribution model.
Let's See MMM in Action
Imagine a big consumer-packaged goods (CPG) brand. For years, they've poured 70% of their marketing budget into traditional TV ads. Why? Because their standard attribution reports always showed TV as a top performer.
But then they run an MMM analysis, and the story changes.
The model reveals that while TV is definitely a contributor, its effectiveness has flatlined. They hit the point of diminishing returns ages ago. Every extra dollar they spend on TV now brings in less than a dollar in return. Ouch.
On the flip side, the model flags influencer marketing as a goldmine—a highly efficient and totally overlooked channel. It predicts that by shifting just 20% of the TV budget to a well-structured influencer program, they could boost overall sales by 5%. All without spending a penny more on marketing.
Armed with this insight, the marketing director can walk into the boardroom with a data-backed case for moving millions from TV to influencers. That's a move that would've seemed way too risky based on last-click attribution alone. This is what measuring marketing effectiveness at a strategic level looks like. When you take this approach, you're much better prepared to understand and report on your key digital marketing performance metrics.
Turning Insights into Actionable Optimizations
Let's be honest. Collecting data and running reports is only half the job. It's actually the less important half. The real magic, the part that actually grows your business, is what you do next. Insights gathering dust on a dashboard are worthless. But insights that spark real action? Those can change everything.
This is where you close the loop. You move from just looking at numbers to actively improving them, creating a flywheel of continuous improvement. The goal is to build a system where data doesn't just inform you—it tells you exactly what to do next. This isn't about a one-off report you run and forget. It's about getting into a rhythm of analyzing, testing, and iterating to get better and better results.
From Data Points to Decision Making
The first step is a mindset shift: start treating your data like a set of instructions, not just a bunch of observations. Whenever you find something meaningful in your analytics, the immediate follow-up question has to be, "Okay, so what are we going to do about it?" This simple question turns passive reporting into a proactive, forward-looking strategy.
For this to actually stick, you need a structured way to review performance. Don't let your analytics become a lonely island. I've seen it happen too many times. You need regular, focused performance meetings to turn those numbers into a shared mission for the team.
These meetings absolutely have to be:
- Data-Centric: Every single conversation should be rooted in specific metrics you're pulling from your dashboards. No "I feel like…" statements allowed.
- Action-Oriented: The main point of the meeting is to walk out with a clear list of what you're going to test or change.
- Blame-Free: These aren't sessions for pointing fingers at a campaign that's struggling. They're about working together to figure out why and find a solution.
Building Your "Test and Learn" Roadmap
A "test and learn" roadmap is your blueprint for making systematic improvements. It’s a living document that lays out the experiments you plan to run based on what your data is telling you. This is how you stop making random changes and start making strategic, prioritized moves.
Let's say your latest deep dive shows a key landing page has a dismal 80% bounce rate on mobile. Instead of panicking and demanding a complete redesign (a common mistake), your roadmap would outline a series of small, focused A/B tests.
Example Test Plan: Tackling High Bounce Rate
- Hypothesis: The headline on the page doesn't match the ad creative, so people get confused and leave.
- Test: We'll A/B test the current headline against a new one that directly mirrors the promise we made in the ad.
- Metric to Watch: Bounce Rate and Time on Page.
- Success Condition: We need to see at least a 20% reduction in the bounce rate on the new version to call it a win.
This methodical approach takes all the guesswork out of optimization. Every action becomes a calculated experiment designed to prove or disprove a hypothesis.
The most effective marketing teams I've ever seen operate like a science lab. They form a hypothesis based on data, run a controlled experiment, analyze the results, and do it all over again. This iterative cycle is the real engine of sustainable growth.
Turning Strategic Insights into Budgetary Shifts
Acting on your data isn't just about tweaking headlines and button colors. It's about having the confidence to make bold, strategic decisions with your budget. Your data should give you the proof you need to shift resources to the channels and tactics that are actually delivering the highest return.
Imagine your Marketing Mix Model (MMM) spits out something surprising. You’ve been pouring cash into paid search, but the data shows that your podcast sponsorships have a 3x higher return on ad spend (ROAS).
This insight is a direct order from your data. The actionable optimization here isn’t subtle—it’s a significant reallocation of your budget.
Example Budget Reallocation
- Insight: Podcast ads are generating higher-quality leads and a much better ROAS than paid search.
- Action: We're going to cut paid search spend by 30% for the next quarter.
- Reinvestment: That freed-up budget will be used to sponsor two more top-tier podcasts in our niche.
- Monitoring: We will closely track lead quality and CAC from the new podcasts to make sure our hypothesis was correct.
This is what measuring marketing effectiveness looks like in the real world. It gives you the evidence you need to make tough calls and double down on what’s working. For many businesses, especially smaller ones, finding these high-impact channels is a game-changer. Exploring a variety of effective small business marketing strategies for growth can help uncover these hidden gems that your data can then validate.
By creating a framework where insights lead directly to experiments and strategic shifts, you transform your marketing from a bunch of disconnected activities into a fine-tuned growth engine. You stop guessing and start knowing.
Common Questions on Marketing Measurement
Alright, so you've got the frameworks and you're eyeing the tools. But let's be real—theory is one thing, and the messy reality of marketing is another. You're up against chaotic data, tight budgets, and maybe even a skeptical boss. It’s completely normal to have questions.
I get it. I've been there. This is where we tackle those tough, real-world roadblocks. Forget the textbook answers; here's the practical advice you need when you're stuck in the trenches.
Where Do I Start If I Have A Tiny Budget?
A small budget feels like a handicap, but I've learned it's secretly a superpower. It forces you to be absolutely ruthless with your focus. You can't afford to waste a single dollar, so every move has to count. Forget the fancy, expensive software for now.
Your new best friends are free, powerful tools like Google Analytics 4 and Looker Studio.
- Go all-in on one channel. Pick the one you know has the most potential and become obsessed with measuring it. If it's email, live and breathe your click-through rates, email-driven conversion rates, and the lifetime value of a subscriber. Master it.
- Track only a couple of crucial metrics. Don't drown yourself in data. To start, just track your Customer Acquisition Cost (CAC) and Conversion Rate for that one channel. Those two numbers alone will tell you the most important thing: are you making money or just burning it?
- Embrace the spreadsheet. A simple Google Sheet can be a shockingly good CRM and results tracker when you're just starting out. It's all you need.
The goal isn't to measure everything at once. It's to build a rock-solid case that a small, focused investment can deliver a real, measurable return. That proof is your ticket to a bigger budget next quarter.
How Do I Deal With Messy or Incomplete Data?
First off, welcome to the club. Perfect, clean data is a marketing unicorn—it doesn't exist. Every single company, from scrappy startups to Fortune 500s, deals with data gaps, tracking bugs, and numbers that just don't line up between platforms.
Don't let the hunt for perfection paralyze you. The trick is to work with what you've got and make incremental improvements.
Start with a quick data audit. What's your biggest blind spot? Maybe you have no idea what happens after a lead fills out a form. That's your first fire to put out.
Your data will never be perfect, but it can be directionally correct. Focus on trends and major shifts instead of sweating the exact numbers. If your conversion rate from organic search suddenly doubles, that’s a huge signal, even if the absolute numbers are a little fuzzy.
Accepting that you'll be working with imperfect information is half the battle. From there, focus on improving your data hygiene over time, one connection at a time. The discipline you put into organizing your data is just as critical as the discipline needed for great creative project management.
How Can I Convince Leadership to Invest in Better Tools?
This is the ultimate test of your measurement chops. Executives don't sign checks for "better tools"—they sign them for business results. You have to stop talking about software features and start talking about the money it will make or save.
You need to build a business case, not a tech request.
| Instead of Saying This… | Say This Instead… |
|---|---|
| "We need this tool for better attribution." | "We're currently blind to 50% of our customer journey. This tool closes that gap, letting us shift $20,000 in ad spend from channels that aren't working to our top performers. We project that will boost our leads by 15%." |
| "Our data is all over the place." | "My team spends 10 hours a week just manually pulling reports. This tool automates that, which frees up 40 hours a month for optimization work that will directly improve our conversion rates." |
| "This platform has advanced analytics." | "Right now, we're always looking in the rearview mirror. This platform's forecasting will help us predict which campaigns will hit big next quarter, so we can finally get ahead of the curve." |
Frame the problem in terms of lost revenue, wasted time, and missed opportunities. Show them the "cost of doing nothing." When you can prove that not buying the tool is actually more expensive than buying it, the whole conversation changes. Your measurement data becomes the key that unlocks the investment.
Ready to turn your marketing efforts into measurable success? At Creativize, we connect you with talented creative professionals who know how to deliver results. Find the right expert for your next project and start building campaigns that make an impact. Explore talent on Creativize today.